01 / Overview
Executive Overview
This project demonstrates a complete cloud data engineering and MLOps workflow for large-scale retail demand forecasting. Raw Walmart M5 files are stored in Amazon S3, processed through Databricks and Delta Lake using a Bronze-Silver-Gold architecture, transformed into model-ready features, evaluated under strict temporal and leakage controls, and materialized as production forecast outputs.
The project goes beyond model training. It includes data-quality validation, experiment tracking, model governance, production forecast generation, monitoring tables, inventory-oriented analytics, a four-page Power BI report, a documented FastAPI service, Docker containerization, and automated API tests.
02 / Business
Business Problem
Retailers must decide how much inventory to position across thousands of products and stores before future demand is known. Under-forecasting creates stockouts and lost sales; over-forecasting creates excess inventory and working-capital cost.
- Forecast demand consistently across product-store combinations.
- Reduce stockout and overstock risk.
- Support safety-stock and reorder-point decisions.
- Provide traceable, governed model outputs.
- Monitor quality failures before forecasts reach downstream consumers.
03 / Architecture
End-to-End Architecture
The platform separates storage, processing, modelling, serving, monitoring, and business intelligence into clear layers. This makes the workflow reproducible and easier to audit.
1
Amazon S3 Raw Zone
Original M5 files are stored outside GitHub in a cloud data lake.
2
Bronze Delta Layer
Raw source structure and ingestion metadata are preserved.
3
Silver Delta Layer
Dates, identifiers, schemas, missing values, and joins are standardized.
4
Gold Analytics Layer
Model-ready demand features, evaluation data, inventory outputs, and monitoring tables are built.
5
Leakage-Safe Modelling
Models are evaluated with temporal separation and horizon-safe features.
6
Production Forecast Run
The selected model generates a governed 28-day forecast for every active item-store series.
7
Serving & BI
FastAPI, Docker, Power BI, and monitoring outputs make results accessible and inspectable.
04 / Data
Dataset and Processing Scale
The project uses the Walmart M5 Forecasting dataset, which combines daily unit sales, calendar events, SNAP indicators, and historical sell prices across multiple stores and product categories.
| Measure | Value | Meaning |
|---|
| Source coverage | 2011-01-29 to 2016-05-22 | Historical daily retail demand window |
| Joined analytical rows | Approximately 46.9 million | Large-scale Spark processing volume |
| Forecastable series | 30,490 | Active item-store combinations |
| Forecast horizon | 28 days | Direct production forecast window |
| Production forecast rows | 853,720 | 30,490 series × 28 forecast days |
05 / Engineering
Data Engineering Pipeline
- Ingest raw M5 calendar, sales, and price files from Amazon S3.
- Validate schemas, source coverage, row counts, and required columns.
- Build clean Silver tables with standardized identifiers and dates.
- Join demand, calendar, event, SNAP, and price information at scale.
- Create Gold datasets for modelling, evaluation, inventory planning, and monitoring.
- Persist critical outputs in Delta tables for reproducibility and downstream consumption.
06 / Quality
Data Quality and Production Controls
Production eligibility is based on explicit controls rather than on model accuracy alone.
| Control | Result | Interpretation |
|---|
| Null forecast rows | 0 | No missing production forecast values |
| Negative forecast rows | 0 | All forecasts satisfy non-negativity constraints |
| Duplicate forecast rows | 0 | Unique series-date output grain |
| Critical alerts | 0 | No blocking monitoring alert in the final run |
| Monitoring readiness | True | Required operational outputs are available |
07 / Forecasting Integrity
Leakage Audit and Horizon-Safe Design
A central engineering lesson was that the model with the lowest apparent error is not automatically the best production model. An earlier hybrid system achieved a lower WAPE, but the final audit identified leakage concerns in its feature construction and selection path.
The governed model therefore uses a direct 28-day horizon-safe baseline. For each target date, it only uses historical observations that would genuinely have been available at forecast origin—approximately t-55 through t-28. The final test period was not used for tuning or champion selection.
Governance decision: accept slightly weaker headline accuracy in exchange for temporal validity, reproducibility, interpretability, and production safety.
08 / Governance
Model Comparison and Governance Decision
Model promotion required both predictive quality and governance eligibility. A challenger had to provide at least 0.50% relative improvement without introducing worse operational behavior.
| Candidate | Test WAPE | Decision | Reason |
|---|
| Legacy hybrid reference | 69.53% | Reference only | Lower numerical error, but retained only as historical evidence because of leakage concerns. |
| Residual challenger | ≈75.55% | Rejected | Relative gain was only about 0.152%, below the 0.50% promotion gate, and bias worsened. |
| Horizon-safe moving average 28 | 75.66% | Promoted | Leakage-safe, stable, interpretable, reproducible, and production-eligible. |
Governed Production Model
| Model name | horizon_safe_moving_average_28 |
| Version | v1.0.0 |
| Status | ACTIVE_PRODUCTION_MODEL |
| Strategy | direct_28_day_horizon_safe_baseline |
| Test used for tuning | False |
| Production eligible | True |
09 / Evaluation
Final Test Performance
WAPE is the total absolute forecast error divided by total actual demand. The score reflects the difficulty of sparse and intermittent retail demand across a very large hierarchy.
10 / Production
Production Forecast Run
The final governed run generated a complete 28-day forecast snapshot with operational quality checks and monitoring readiness.
| Forecast run ID | forecast_20260729_122428_95fe2427 |
| Forecast origin | 2016-05-22 |
| Forecast window | 2016-05-23 to 2016-06-19 |
| Forecast rows | 853,720 |
| Active series | 30,490 |
| Total forecast units | 1,199,197.57 |
| Average units per row | 1.4047 |
| Zero-forecast rate | 3.75% |
11 / Operations
Inventory and Operational Analytics
Forecast outputs are converted into decision-support views for inventory planning. The platform is designed to support expected demand, safety stock, reorder points, stockout-risk prioritization, excess-inventory identification, and category/store drill-downs.
12 / MLOps
MLOps and Governance
- MLflow experiment tracking and run comparison.
- Champion-model metadata and versioning.
- Validation/test separation and test-use audit.
- Forecast-run IDs and reproducible output snapshots.
- Monitoring tables for WAPE, MAE, RMSE, bias, coverage, nulls, negatives, duplicates, and alerts.
- Explicit production eligibility and promotion gates.
13 / Business Intelligence
Power BI Forecast Intelligence
A four-page Power BI report communicates executive KPIs, forecast performance, category-level behavior, production volumes, and model-governance status. The exported report is stored in the GitHub repository.
Open Power BI Report
14 / Serving
FastAPI Serving Layer
A modular FastAPI service exposes governed model metadata, production forecast summaries, service health, and representative 28-day item-store forecasts. Swagger and ReDoc documentation are generated automatically.
| Method | Endpoint | Purpose |
|---|
| GET | / | Service information |
| GET | /health | Liveness and runtime status |
| GET | /model-info | Governed model metadata and test metrics |
| GET | /forecast-summary | Production snapshot and quality statistics |
| GET | /forecasts/{item_id}/{store_id} | Representative local 28-day demo series |
Transparent data-source boundary: Model metadata and aggregate forecast values represent governed production snapshots. The item-store endpoint is explicitly labelled as local_demo_fixture and is not presented as a live Databricks SQL query.
15 / Deployment
Docker and Reproducible Execution
The API is packaged in a lightweight Python 3.10 Linux image. This eliminates machine-specific dependency differences and provides a consistent runtime for local demonstration or future deployment.
docker build -t retail-demand-forecasting-api:v1.0.0 .
docker run --rm -p 8000:8000 --name retail-forecast-api retail-demand-forecasting-api:v1.0.0
16 / Quality Assurance
Automated Testing
Pytest and the FastAPI test client validate service availability, model metadata, forecast-summary values, 28-day series structure, non-negative predictions, data-source transparency, and correct 404 behavior.
6 automated tests passed
17 / Evidence
Selected Project Evidence
Screenshots are loaded automatically when matching files are available in the website image folder.
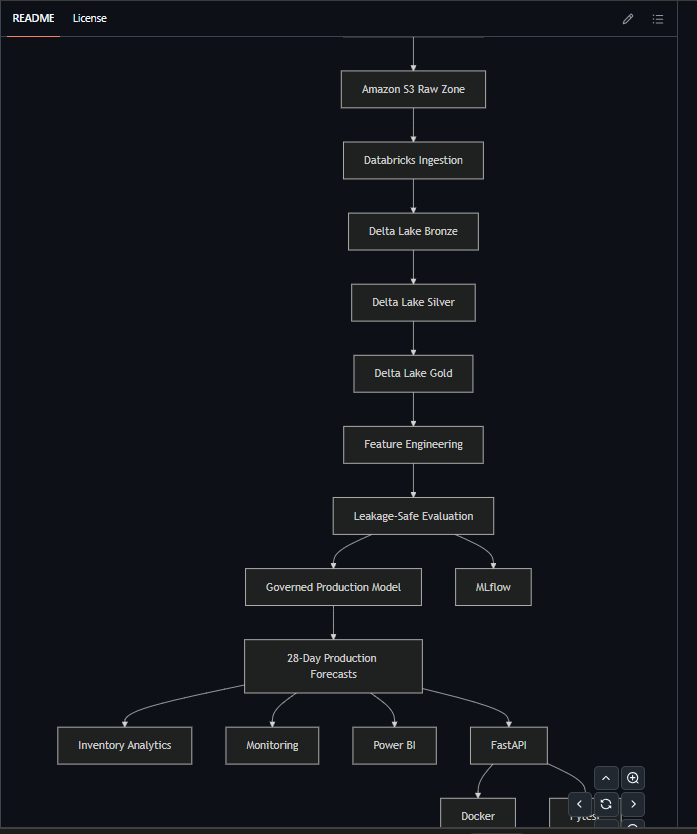
End-to-end retail forecasting and MLOps lakehouse architecture.
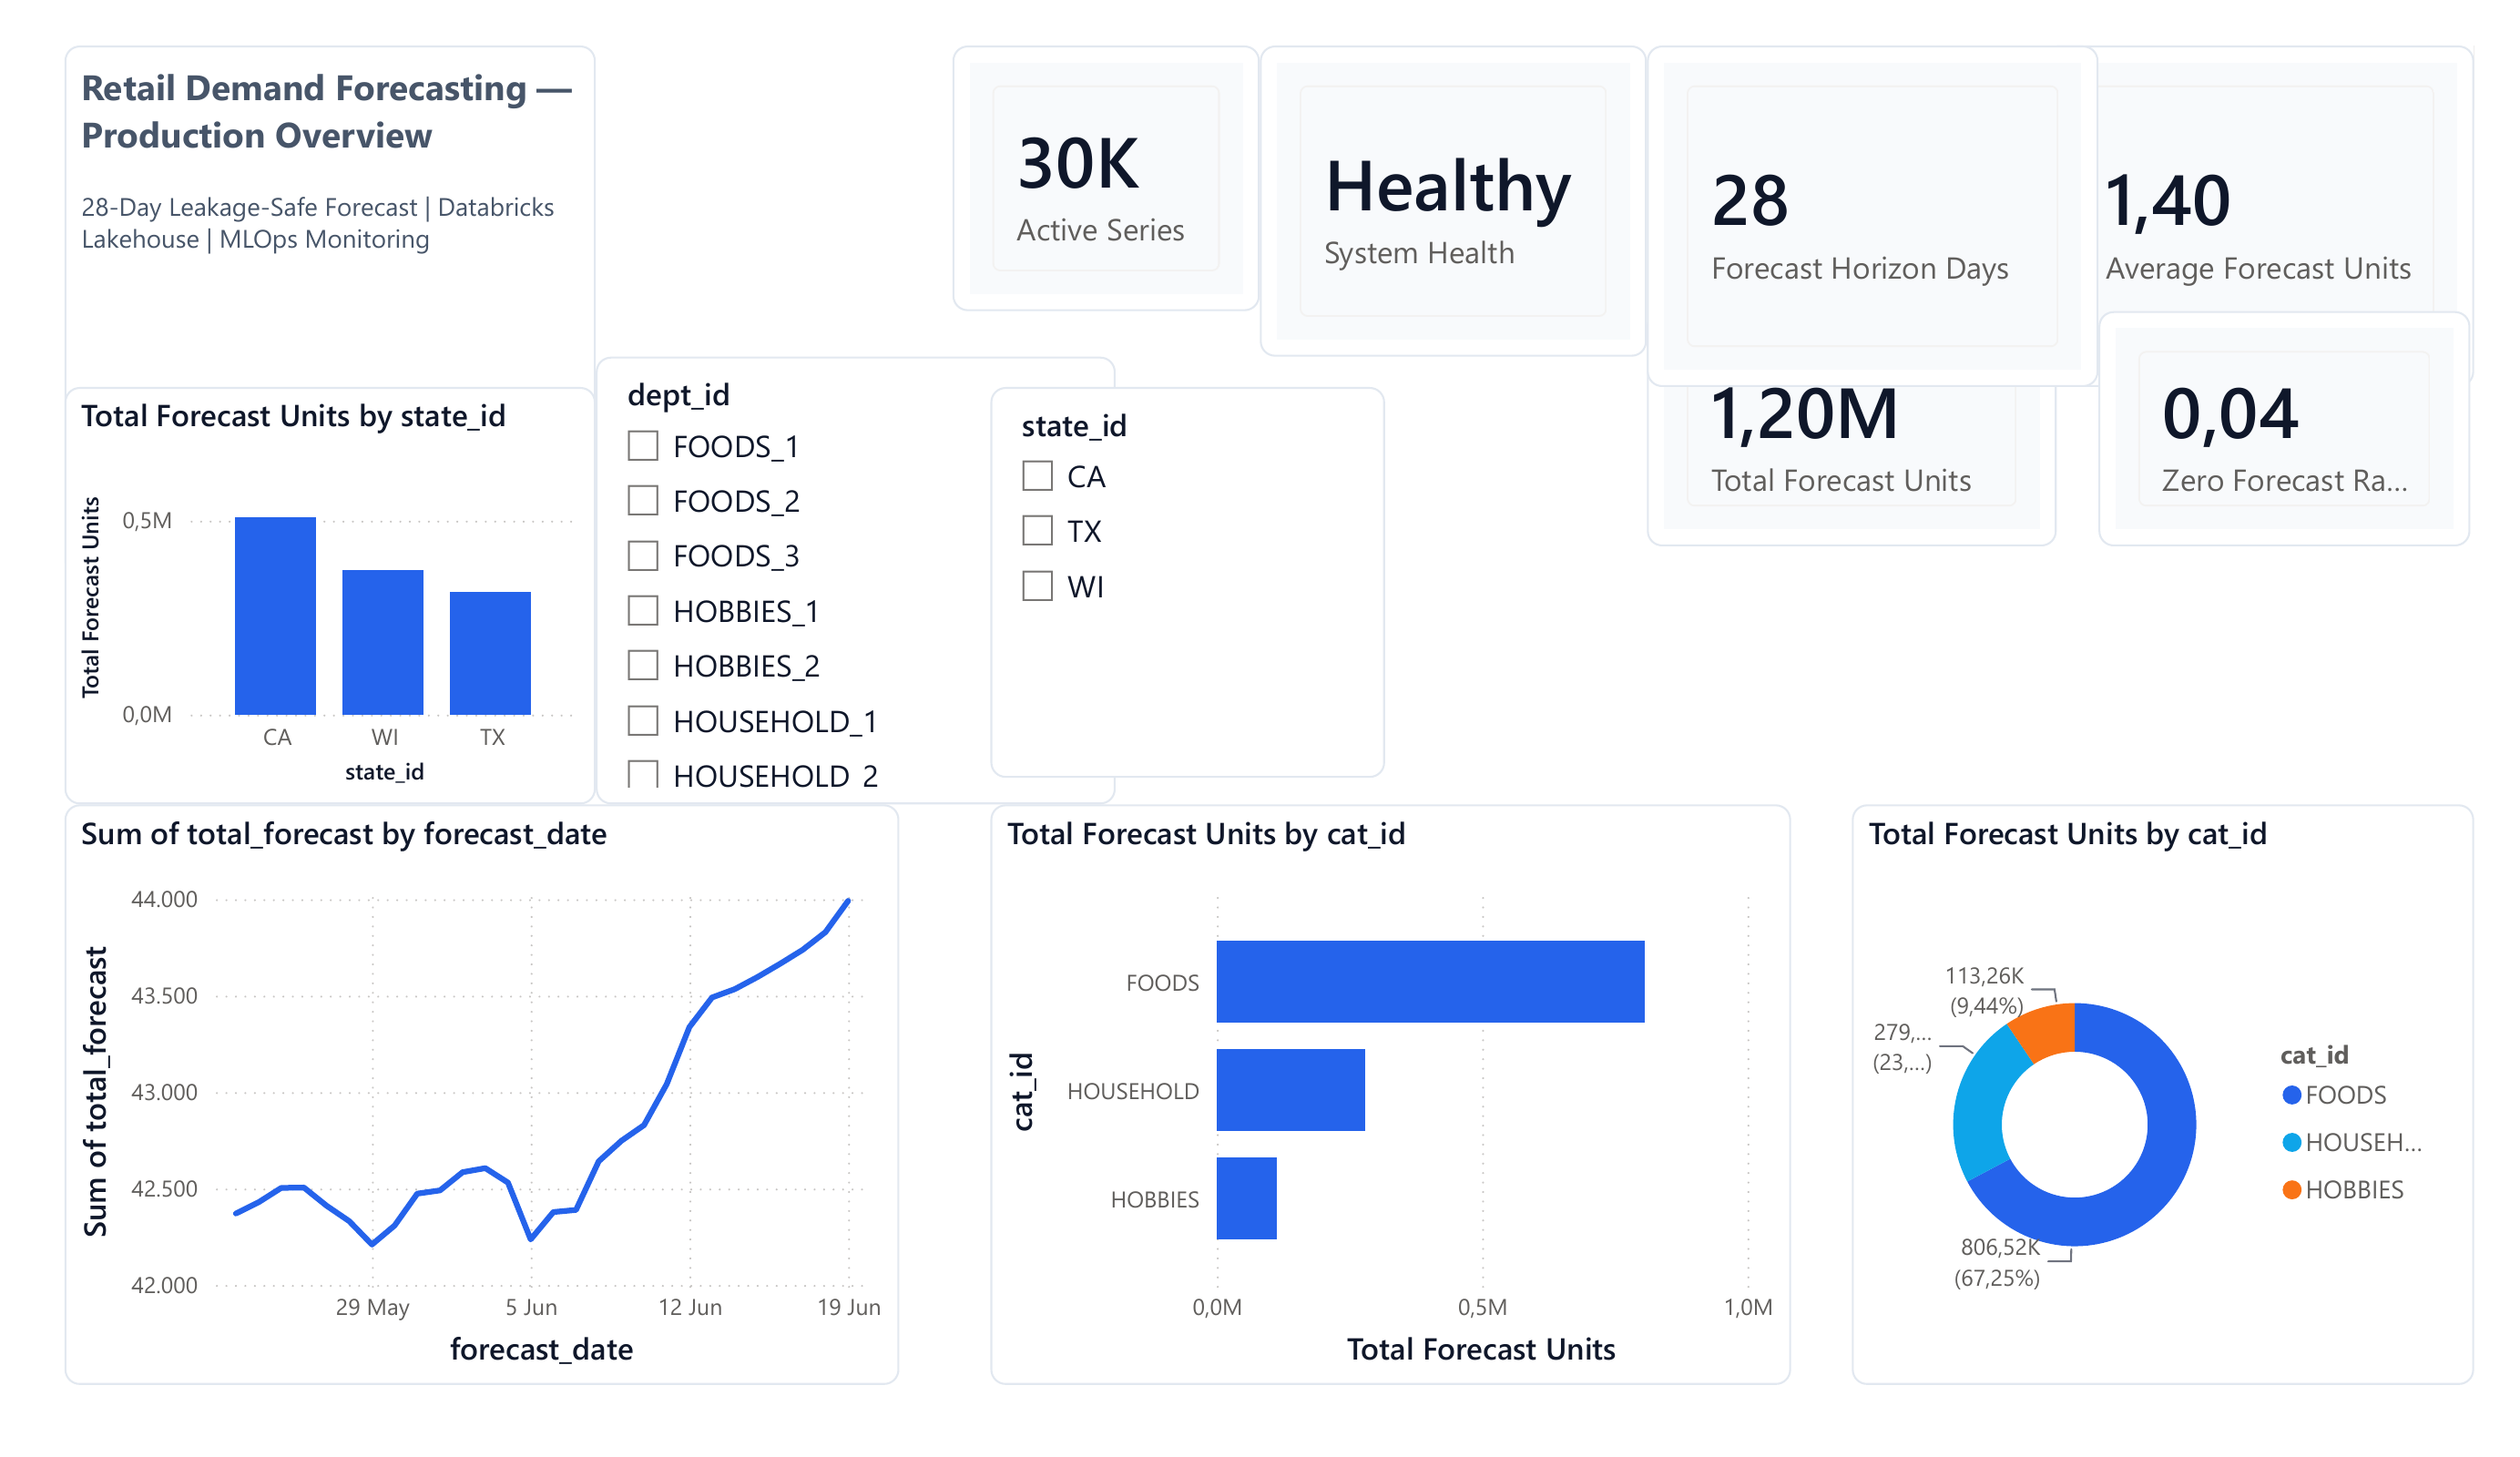
Power BI executive overview with production forecast KPIs.
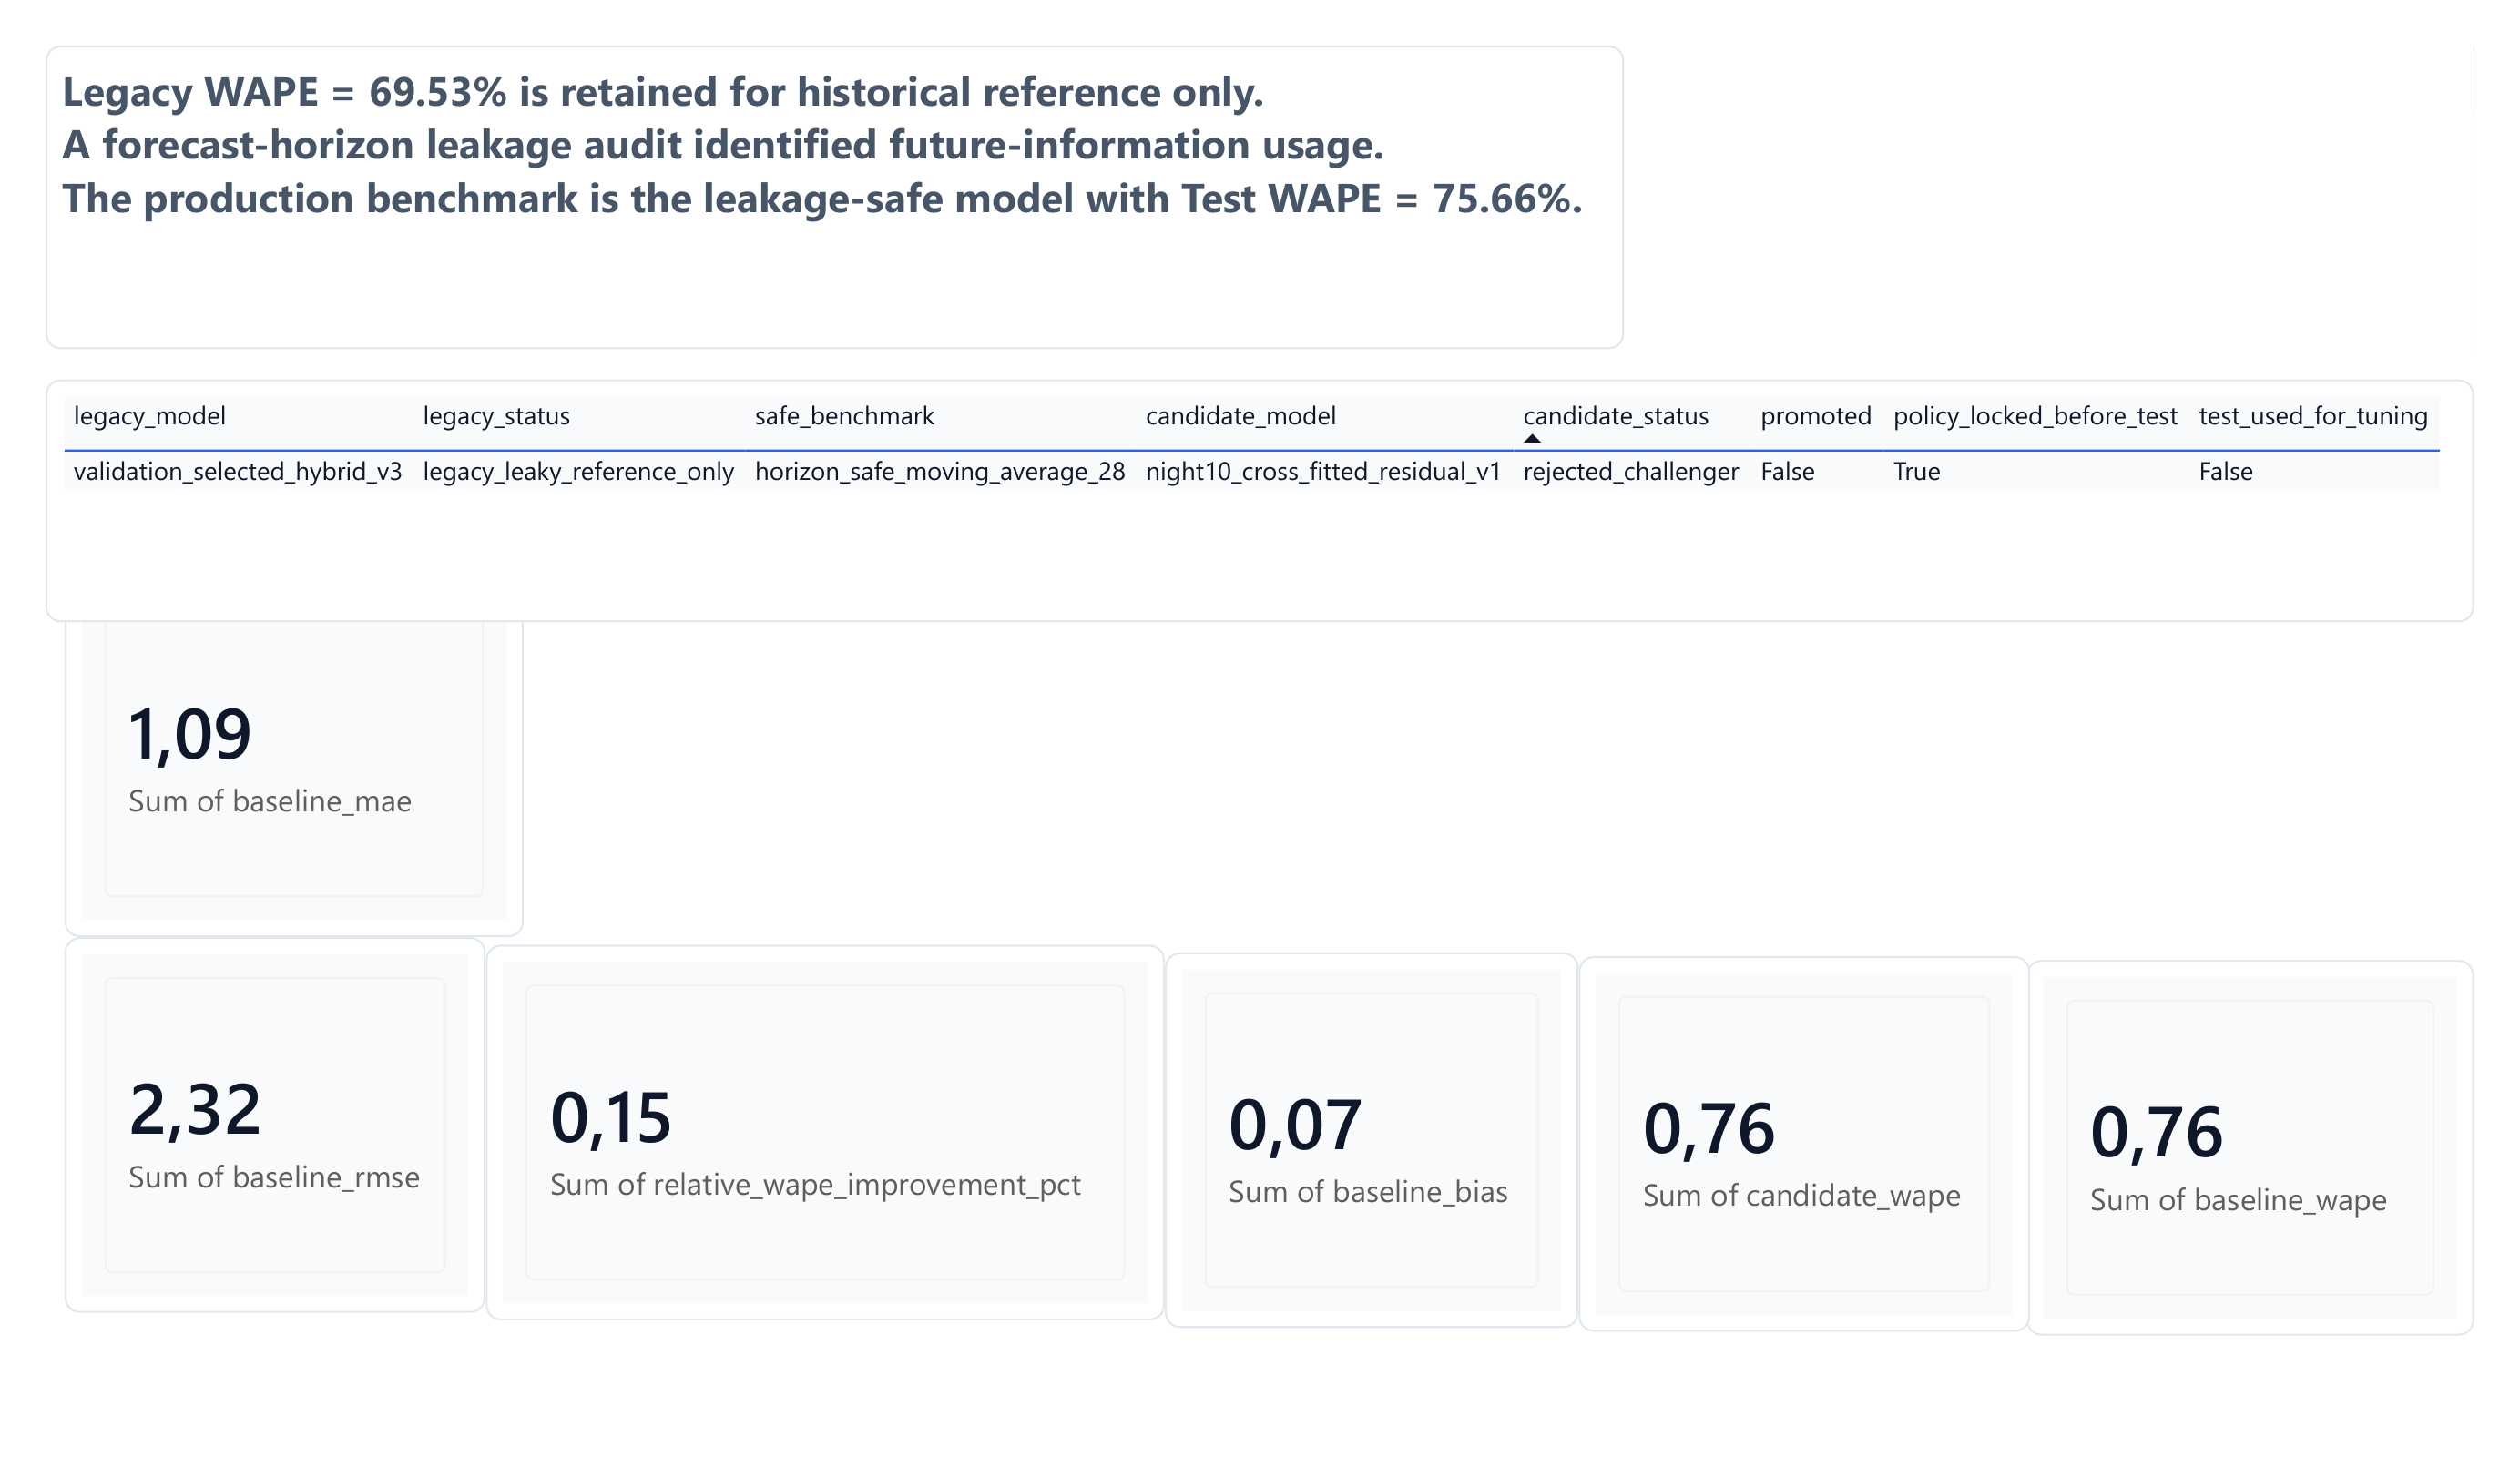
Model governance and leakage-audit dashboard.
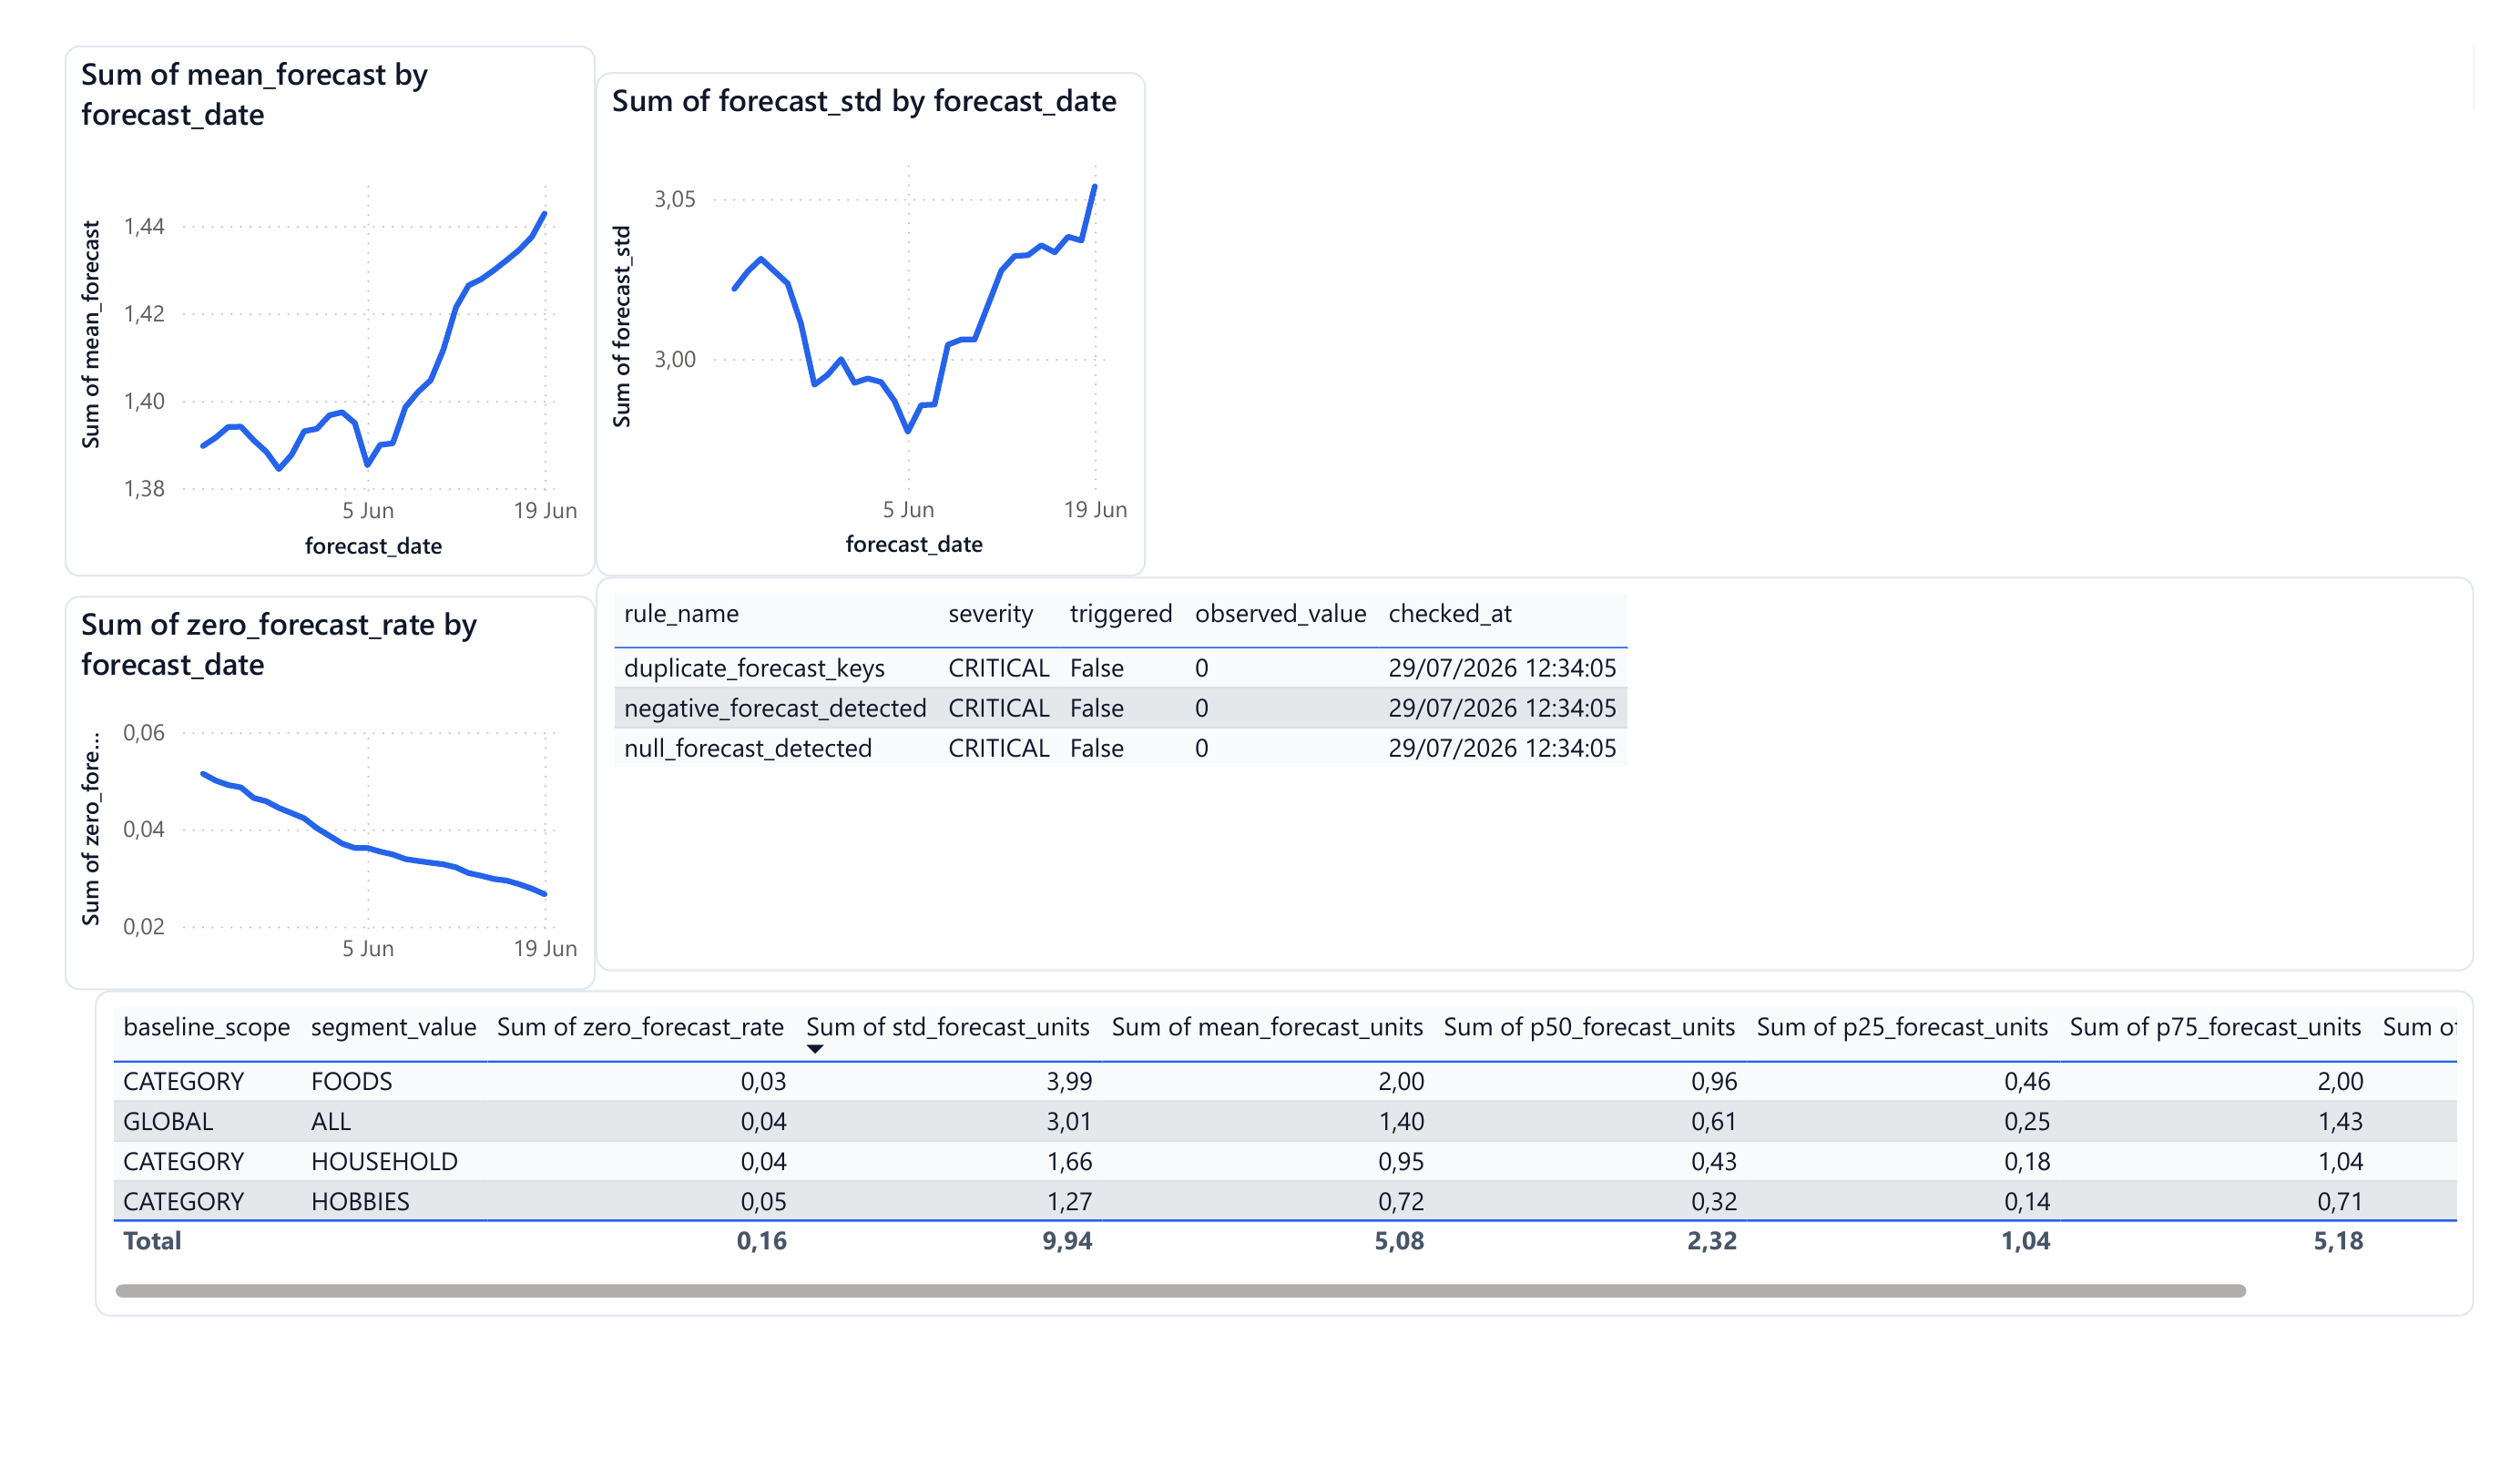
Forecast monitoring, quality controls, and alert readiness.
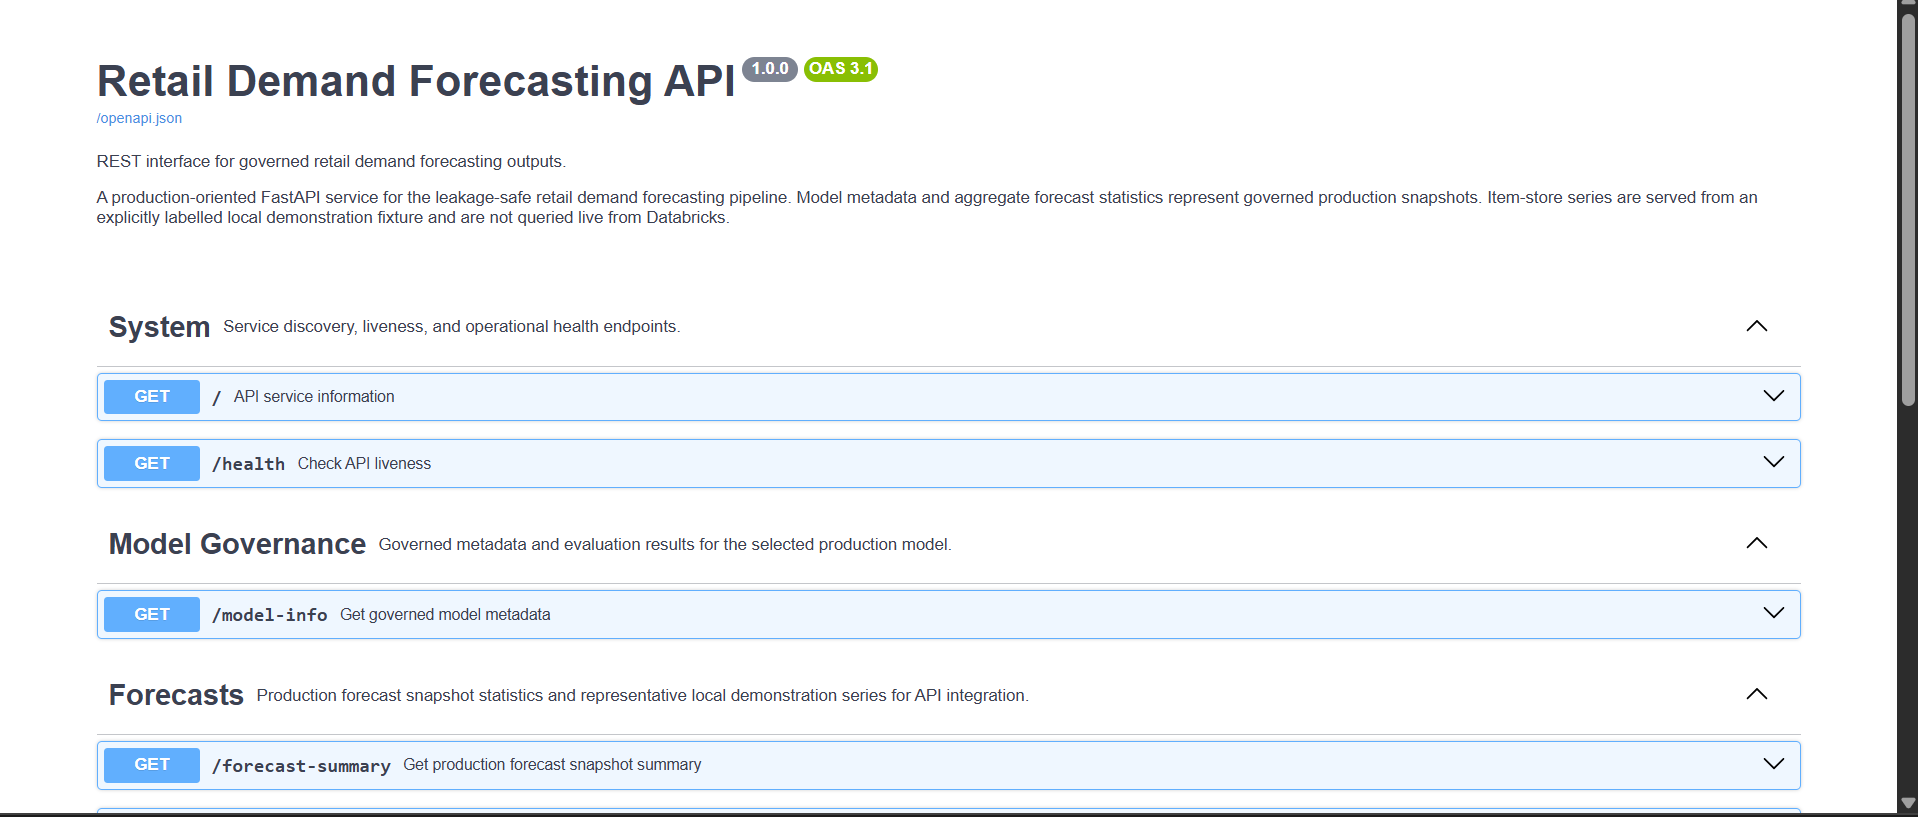
FastAPI OpenAPI documentation and forecast endpoints.
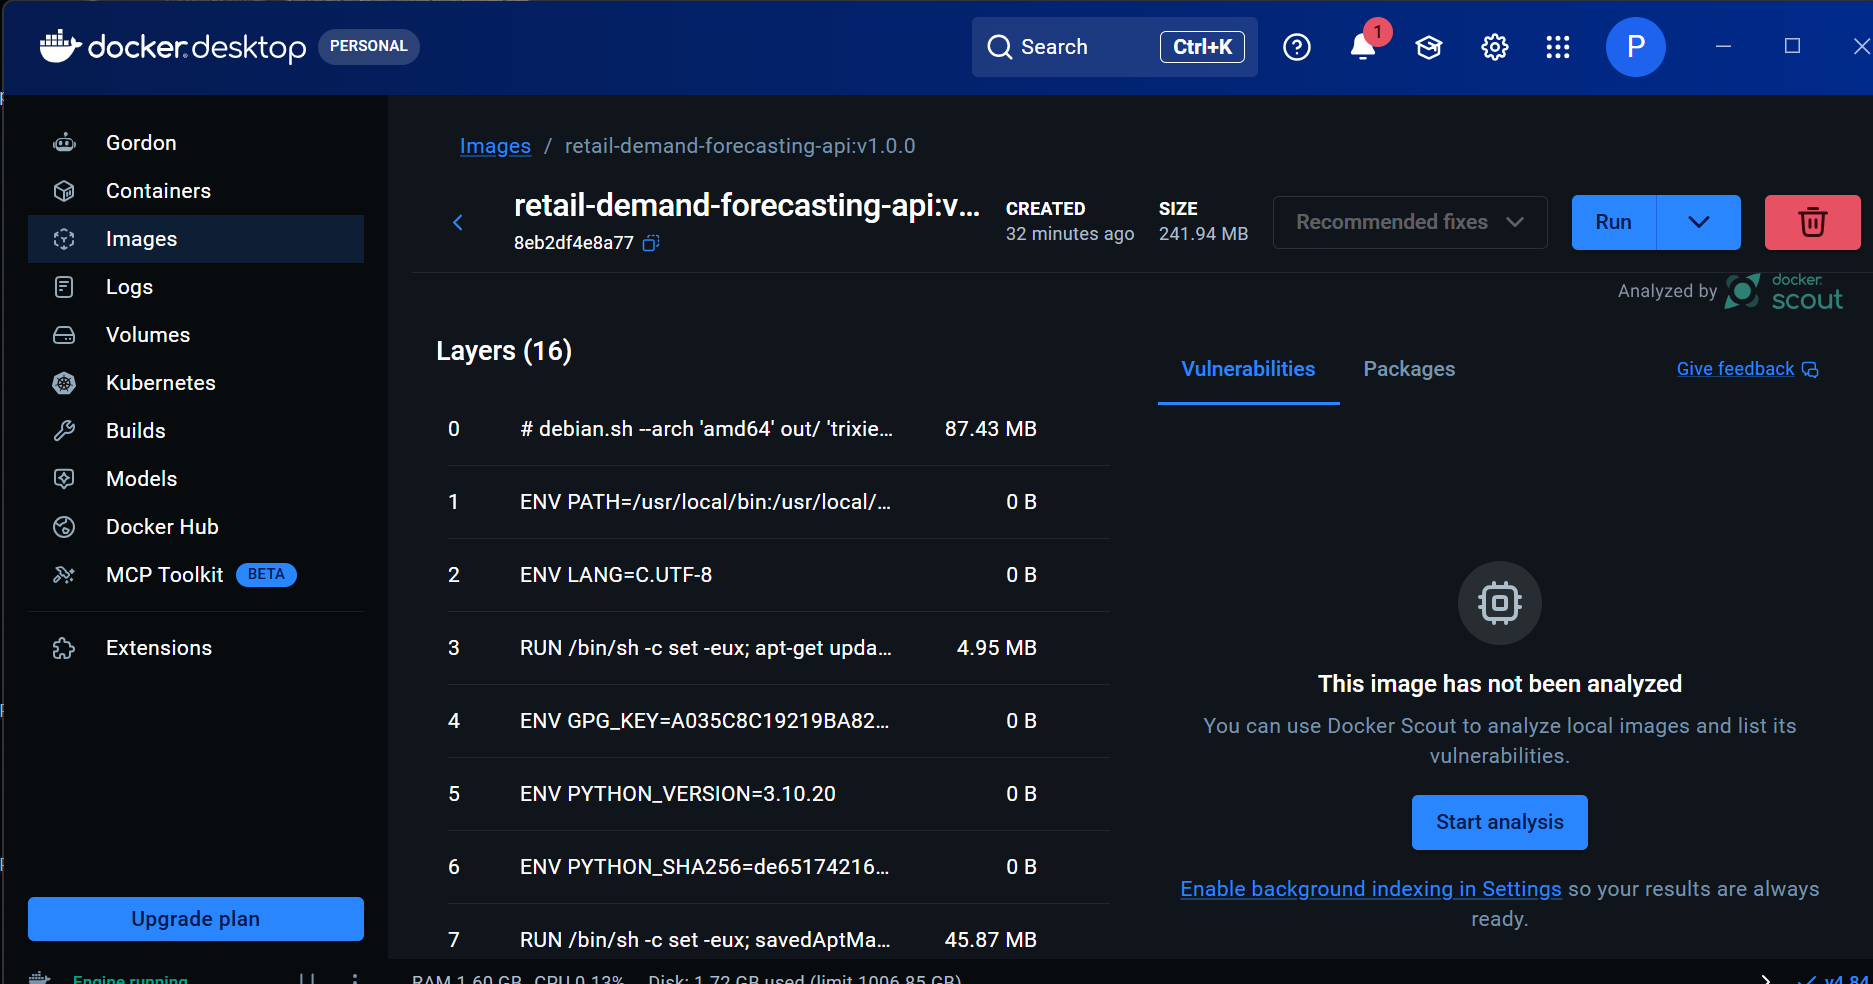
Containerized API running with Docker Desktop.
18 / Stack
Technology Stack
Cloud & Lakehouse
AWS S3DatabricksDelta LakeDatabricks SQL
Data Engineering
PySparkSpark SQLMedallion ArchitectureParquet
ML & MLOps
PythonMLflowTime-Series ForecastingModel Governance
Serving & Quality
FastAPIPydanticUvicornPytestHTTPX
Deployment & BI
DockerPower BIDAXGitHub
19 / Transparency
Current Limitations
- The item-store API endpoint uses an explicit local demo fixture rather than a live Databricks adapter.
- The API is containerized but not publicly hosted in the cloud.
- The Power BI report is shared as an exported PDF rather than a public interactive workspace.
- Intermittent retail demand remains difficult and limits achievable point-forecast accuracy.
- Automated CI/CD and scheduled retraining are future extensions.
20 / Learnings
Key Engineering Lessons
- Temporal validity matters more than an artificially strong benchmark.
- Model governance must combine accuracy, leakage safety, bias, reproducibility, and operational checks.
- Production forecasting requires reliable data contracts and monitoring—not only notebooks.
- Clear documentation of limitations increases technical credibility.
- Serving, containerization, tests, and BI turn a modelling exercise into an end-to-end engineering project.
21 / Outcome
Project Outcome
This is one of my strongest portfolio projects for Data Engineering, Cloud Data Engineering, Analytics Engineering, and MLOps roles. It demonstrates large-scale Spark processing, lakehouse architecture, temporal modelling discipline, model governance, API design, containerization, automated testing, and executive reporting in one coherent system.
The final result is not only a forecast model, but a traceable production-oriented data product with documented engineering trade-offs and clear boundaries between implemented functionality and future extensions.